This may not be a surprise to many males, but human females are unlike the rest of the animals on earth. Human females have a unique and totally differentiating factor from nearly all other animal life; their bodies cease being capable of pregnancy approximately half way through their life cycle. This natural change to sterility (menopause) does not happen in the animal kingdom (nor in human males) essentially so long as they live (ok, actually there may be a couple of whales and porpoises that may also go through menopause...but I digress). Animals and male humans are still able to reproduce nearly until the end. But not human females. Even before menopause fully takes over, typically around 50 years of age, fertility rates drop radically after 40 and miscarriages surge among those able to get pregnant. By 45, pregnancies essentially cease.
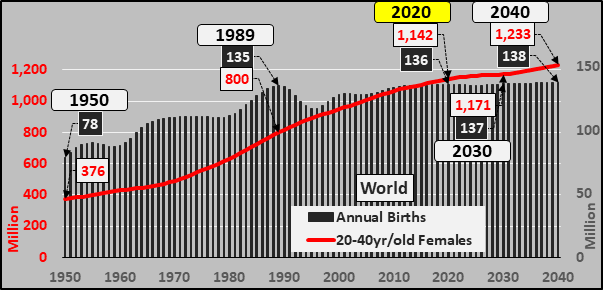
What the hell does this have to do with economics, you may be asking yourself? Judging the size and change of humankinds population is quite different than any other species on earth because of this truncated period of fertility among human females. Thus, to gauge the direction of our species, and the future consumption and potential economic activity, we must focus on annual births versus the 20 to 40 year-old female population and understand that the post childbearing, 40+ year-old female population is, from a fertility perspective, simply an inert echo chamber. The 20 to 40 and 40+ year-old populations shown below through 2040 are not estimates or projections but actual persons which already exist and (absent some pandemic, world war, or change in life spans) will slide through the next 20 years. All data (except where noted) comes from the UN World Population Prospects 2019 and they collect / compile all the data from the national and regional bodies. The only real variables in what I'll show below are immigration, deaths, and births over the next 20 years. I also primarily focus on the world excluding Africa. Africa consumes so little, has relatively very low emigration rates, is highly reliant on the rest of the world for it's economic growth, but from a population perspective, is growing so rapidly as to skew the picture.
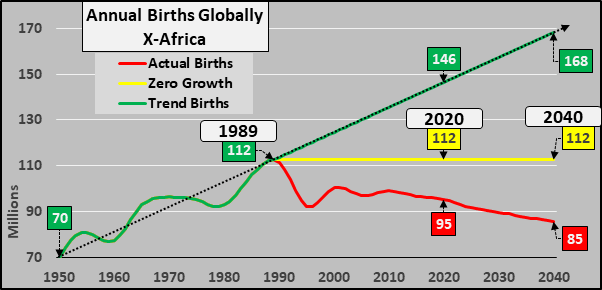
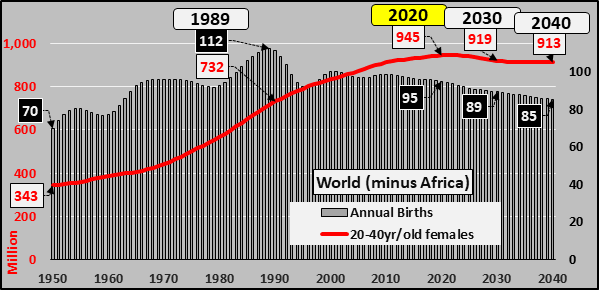
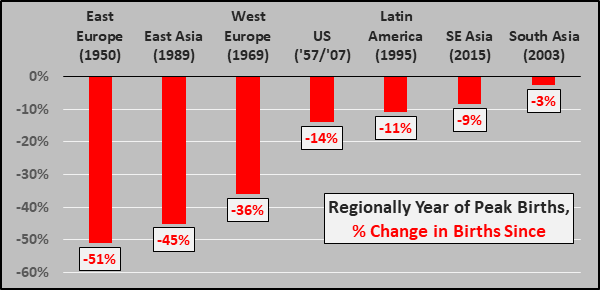
The 80% of the world population that consumes 97% of exports/energy is at the onset of an indefinitely declining childbearing population, and coupled with ongoing declines in fertility rates, the UN projects that the decline in births (excluding Africa) taking place since 1989 will only continue. But I'll show why significantly lower annual births are far more realistic than the UN projections. And given nation after nation is reporting "shocking" declines in births in 2018 and again 2019...the estimated numbers of births are only set to be significantly lower as something very momentous appears to be happening.
What the hell does this have to do with economics, you may be asking yourself? Judging the size and change of humankinds population is quite different than any other species on earth because of this truncated period of fertility among human females. Thus, to gauge the direction of our species, and the future consumption and potential economic activity, we must focus on annual births versus the 20 to 40 year-old female population and understand that the post childbearing, 40+ year-old female population is, from a fertility perspective, simply an inert echo chamber. The 20 to 40 and 40+ year-old populations shown below through 2040 are not estimates or projections but actual persons which already exist and (absent some pandemic, world war, or change in life spans) will slide through the next 20 years. All data (except where noted) comes from the UN World Population Prospects 2019 and they collect / compile all the data from the national and regional bodies. The only real variables in what I'll show below are immigration, deaths, and births over the next 20 years. I also primarily focus on the world excluding Africa. Africa consumes so little, has relatively very low emigration rates, is highly reliant on the rest of the world for it's economic growth, but from a population perspective, is growing so rapidly as to skew the picture.
The 80% of the world population that consumes 97% of exports/energy is at the onset of an indefinitely declining childbearing population, and coupled with ongoing declines in fertility rates, the UN projects that the decline in births (excluding Africa) taking place since 1989 will only continue. But I'll show why significantly lower annual births are far more realistic than the UN projections. And given nation after nation is reporting "shocking" declines in births in 2018 and again 2019...the estimated numbers of births are only set to be significantly lower as something very momentous appears to be happening.
Last 70 years...
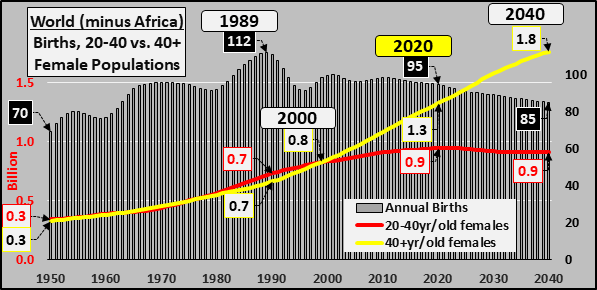
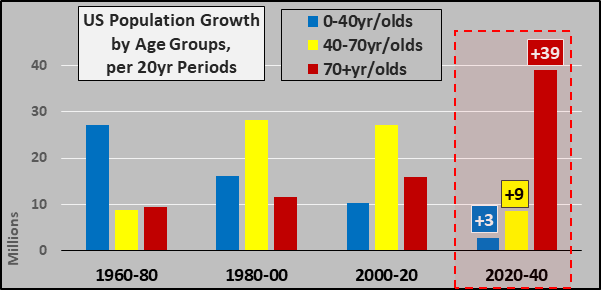
1950-'89 +32 million annual births, +375 million female 20-40 year-olds, +320 million female 40+year-olds
1989-'20 -17 million annual births, +230 million female 20-40year-olds, +680 million female 40+year-olds
1950-'89 +32 million annual births, +375 million female 20-40 year-olds, +320 million female 40+year-olds
1989-'20 -17 million annual births, +230 million female 20-40year-olds, +680 million female 40+year-olds
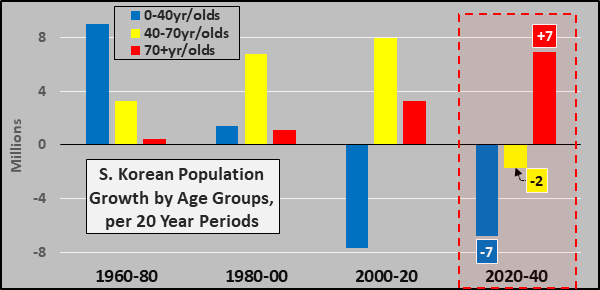
Next 20 years...
2020-'40 -10 million births annually by 2040, -32 million female 20-40year-olds, +435 million female 40+year-olds
2020-'40 -10 million births annually by 2040, -32 million female 20-40year-olds, +435 million female 40+year-olds
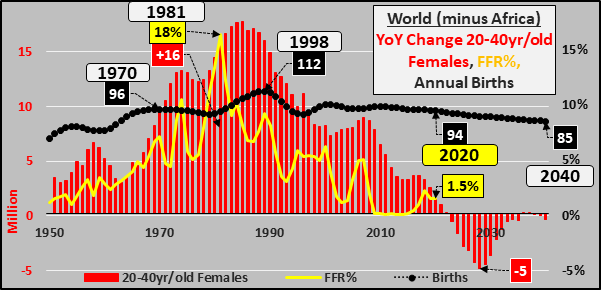
 Below, looking at the same data as above, but focusing on the year over year change of 20 to 40 year-olds (red columns) versus the same for 40+ year-olds (blue columns), annual births (black line), and federal funds rate (yellow line). From a global population perspective, the 1980's were the turning point; federal funds rate peaking in 1981 (restricting access to capital as the growth in global demand was at its zenith), annual childbearing female population growth peaking in 1985 (adding nearly 18 million females in that year alone), and annual births subsequently peaking in 1989. Since 1989, the under 40 year old annual growth keeps decelerating, the births keep declining, and the federal funds rate moving lower. In 2020 or 2021, the global childbearing population of females (excluding Africa) will begin outright declining. The only thing rising was the annual growth of the 40+ year old population. However, the echo of annual growth among the post childbearing female population will peak around 2028...and then rapidly begin the deceleration glide path (still growing, but much slower while the childbearing population will continue to be in outright decline indefinitely).
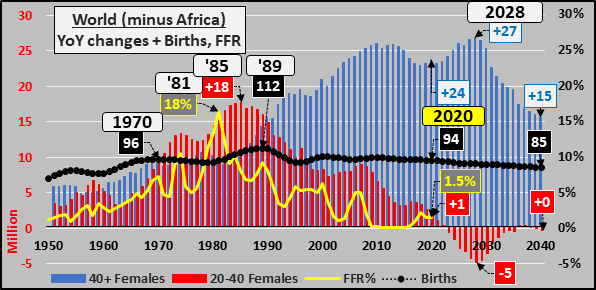 Looking at the picture through the global regions.
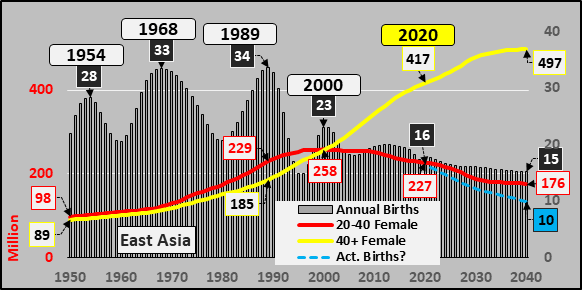
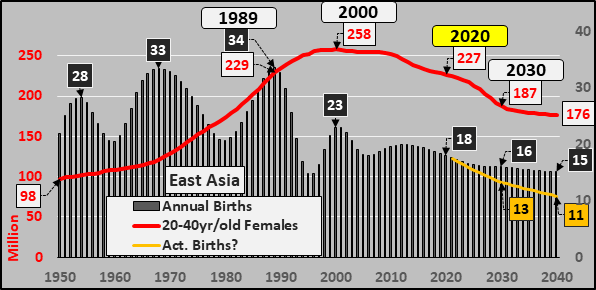
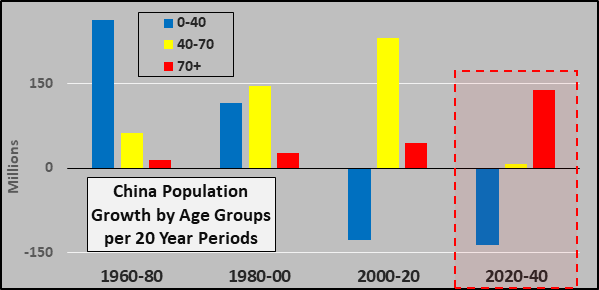
East Asia (China, Japan, Taiwan, S/N Korea, Mongolia)
For East Asia, 1989 was peak annual births, and the crossover point of post-childbearing outnumbering childbearing was in 2000. Births continue tanking and so is the childbearing female population. Only the fertility-wise inert post childbearing population continues soaring. By 2040, the region is set to reach a 2.8 post-childbearing to childbearing ratio. The higher this ratio moves, the greater the financial and societal pressure of elderly generations on the younger generations...further negatively impacting fertility rates and economic demand/growth.
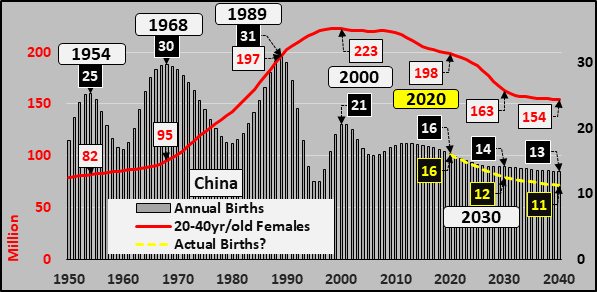
China
2020 births will be about 50% lower than the 1989 peak, and given the known decline of a minimum of 45 million females of childbearing age by 2040 (and almost 70 million fewer, or -30% fewer, than the 2000 peak) there is really no good reason (other than massive government intervention) that births don't fall significantly further. Today it was announced that 2019 births continued to spiral lower, at 14.5 million (53% below peak births). My guestimate below for Chinese births, blue dashed line, is likely to be too "optimistic". By 2040, there will be more than 2.7 post-childbearing females for every potential mother. And now a trade deal with a nation that has an indefinitely shrinking domestic demand and massive housing over-capacity, factory overcapacity, etc. for a population (let alone middle class population) that will never be coming...hmm, interesting.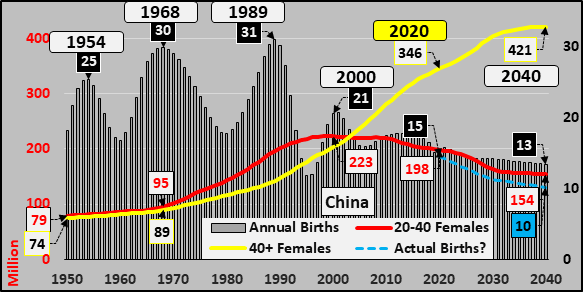
2020 births will be about 50% lower than the 1989 peak, and given the known decline of a minimum of 45 million females of childbearing age by 2040 (and almost 70 million fewer, or -30% fewer, than the 2000 peak) there is really no good reason (other than massive government intervention) that births don't fall significantly further. Today it was announced that 2019 births continued to spiral lower, at 14.5 million (53% below peak births). My guestimate below for Chinese births, blue dashed line, is likely to be too "optimistic". By 2040, there will be more than 2.7 post-childbearing females for every potential mother. And now a trade deal with a nation that has an indefinitely shrinking domestic demand and massive housing over-capacity, factory overcapacity, etc. for a population (let alone middle class population) that will never be coming...hmm, interesting.
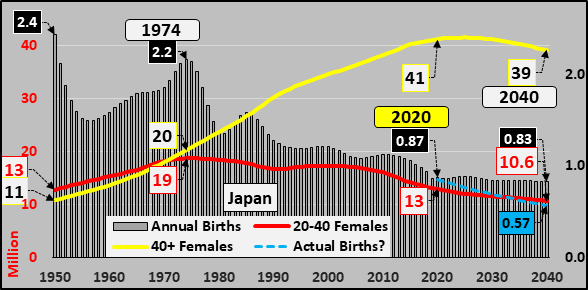
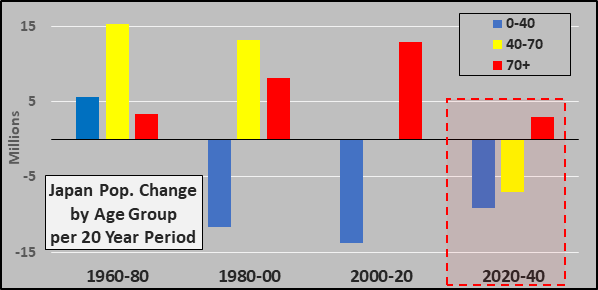
Japan
If Japan were a human, now would be about the time to bring in hospice care. From a growth perspective, they are terminal as even the 40+ year-old segment is now making its turn to decline along with births and the childbearing population. By 2040, there will be more than 3.7 post-childbearing females for every potential mother. What saved Japan during the long decline in domestic demand, a long rise in global export demand...is now over. The Japanese / German models of reliance on exports to make up for decelerating/declining domestic demand was premised on fast rising global demand which is simply no longer supported by a growing global population of potential consumers.
If Japan were a human, now would be about the time to bring in hospice care. From a growth perspective, they are terminal as even the 40+ year-old segment is now making its turn to decline along with births and the childbearing population. By 2040, there will be more than 3.7 post-childbearing females for every potential mother. What saved Japan during the long decline in domestic demand, a long rise in global export demand...is now over. The Japanese / German models of reliance on exports to make up for decelerating/declining domestic demand was premised on fast rising global demand which is simply no longer supported by a growing global population of potential consumers.
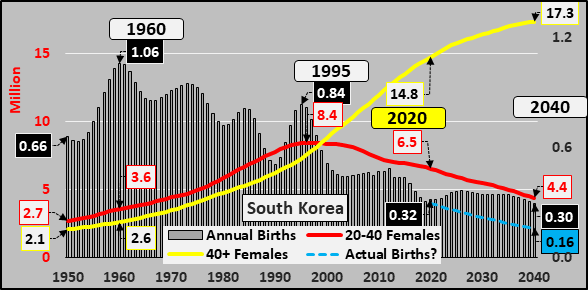
 South Korea
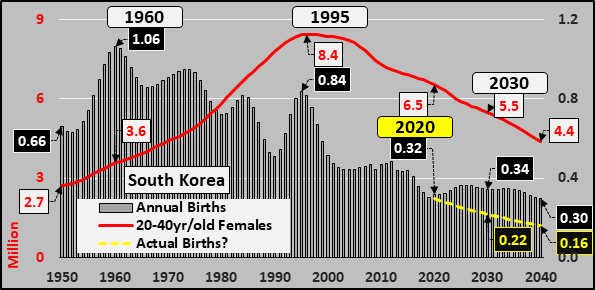
Again and again I am shocked when I look at South Korea. The 70% collapse in annual births will only continue picking up speed to the downside as those capable of childbearing are in freefall...while the 40+ population dwarf's the under 40 year-olds by more than 2 to 1 now and will be almost 4 to 1 by 2040 (a done deal, not a prediction). Absent state mandated pregnancies (or the like) births will fall in excess of 80% and may even be down 90%+ by 2040? A society collectively choosing not to reproduce or replace themselves...essentially committing a collective suicide at a time of the most relative plenty Korea has ever known, it boggles the mind!?! Again, collapsing domestic demand while global export markets are turning away and inward to meet their needs...it boggles the mind and this is not going to be pretty.
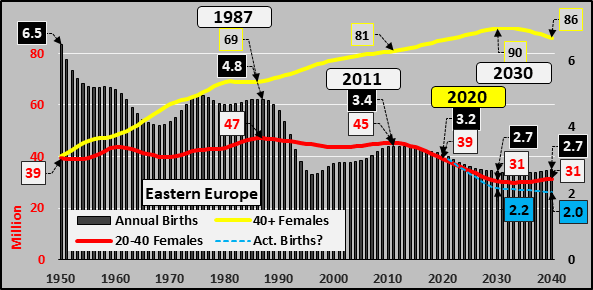
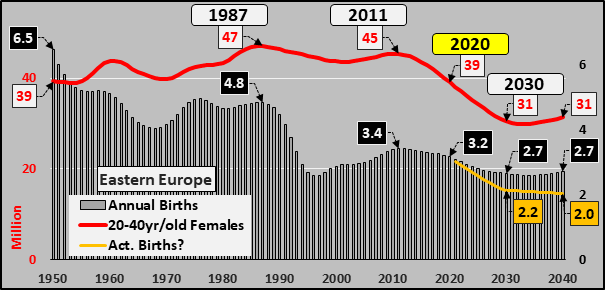
 Eastern Europe (Russia, Belarus, Bulgaria, Ukraine, Czechia, Hungary, Poland, Moldova, Romania, Slovakia)
By 2030, the childbearing females of Eastern Europe will be nearly a third fewer than existed as of 2011. I am suggesting that given a third fewer potential females of childbearing age and given continuing flat to falling fertility rates...births will be significantly lower than the UN is projecting. The existing decline of 50% is likely to be down something like 70%+ by 2040. Like Japan, Eastern Europe's post-childbearing population is set to begin declining around 2030, and accelerating depopulation will be the order of the day. 2030 will also be the peak post-childbearing to childbearing ratio at nearly 3 to 1.
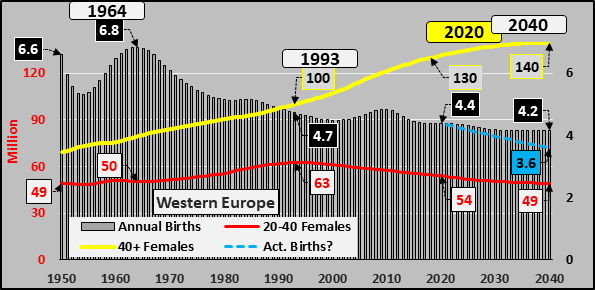
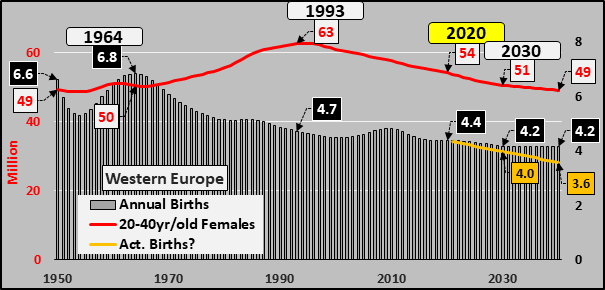
 Western Europe
Not as dramatic as East Asia or Eastern Europe thanks to ongoing immigration, but the destination is the same. Growing quantities among the post childbearing population and ever fewer births and potential mothers. Almost a 2.9 post child-bearing to child-bearing ratio by 2040. The weight of the promises made to the old to be paid from the young is a crushing weight only further depressing births.
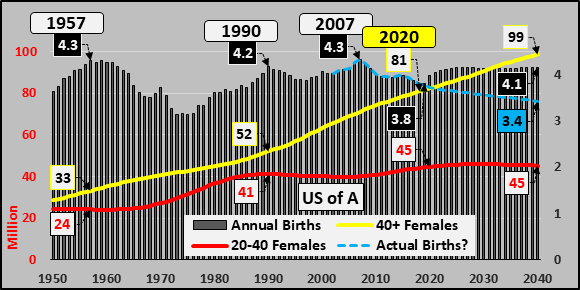
 United States
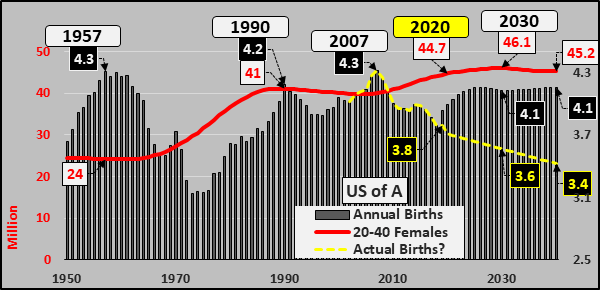
The charts for the US have a big problem, they assume high rates of immigration (primarily of childbearing age) to maintain a flat childbearing population shown from 2020 through 2040. However, the reality is that in 2019, the US had the lowest population growth in it's history for three reasons; tanking births, net outflow among illegal Mexicans, and far tighter border controls reducing illegal immigration to a relative trickle. Further, the locations that legal US immigrants are now coming from (China, India) and the education and income levels of the females coming in...these immigrants have even lower fertility rates than the general US population.
For the native population, there are surging costs of living (rent, healthcare, insurance, daycare, education, etc.) above / beyond rising income, forcing couples to be DINK's (dual income, no kids) just to avoid financial wreck. Getting married and having children is simply a luxury more and more simply find beyond their means...and given widely available contraceptives, this is more of a choice than ever. The US ratio of post childbearing to childbearing will be a minimum of 2.2 by 2040...but if the childbearing population falls, as I expect, the ratio (and societal weight it represents) will move northward.
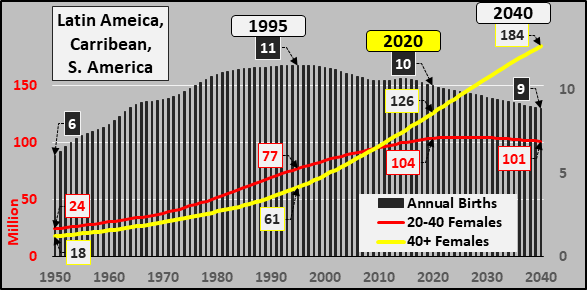
 Latin America (Western Hemisphere except US/Canada)
Births are declining, the childbearing population is at it's zenith and will shortly begin its secular decline, and only the post-childbearing population is growing. By 2040, the childbearing to post childbearing ratio will be about 1.8 to 1.
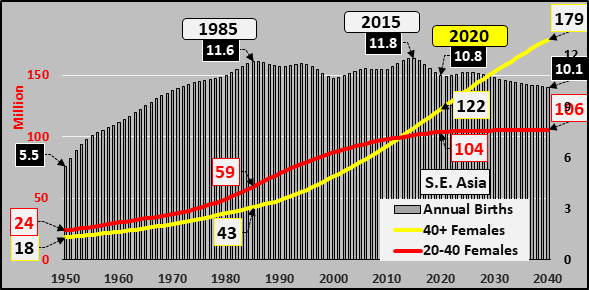
 Southeast Asia (Cambodia, Brunei, Indonesia, Lao, Malaysia, Myanmar, Philippines, Singapore, Thailand, Vietnam)
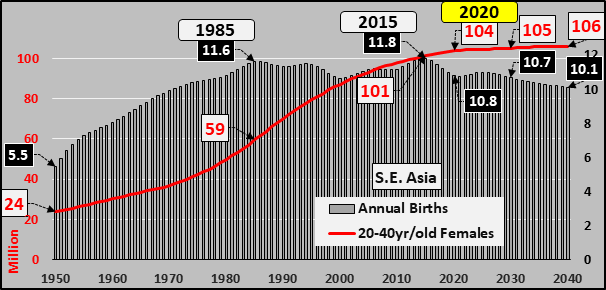
The growth of the childbearing population is over and a decades long period of a flat childbearing population is underway. Births will likely slowly recede with declining fertility rates among a zero growth childbearing population. By 2040, the post childbearing will outnumber the childbearing by a 1.8 to 1 ratio.
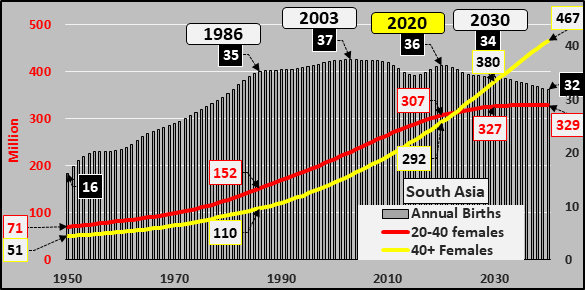
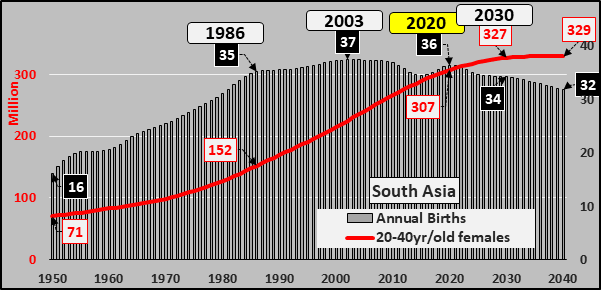
 South Asia (India, Pakistan, Afghanistan, Bangladesh, Iran, Bhutan/Nepal, Sri Lanka)
Like Southeast Asia, a long period of zero growth among annual births will be coming through the childbearing population beginning in 2030. By 2040, India's childbearing population will essentially be at it's peak and the 1.4 post childbearing to 1 childbearing ratio will be ready to rip higher over the next two decades. The engine of population growth among the worlds most populous region has already stalled and begun to reverse although it will take decades before this is apparent in the overall population numbers.
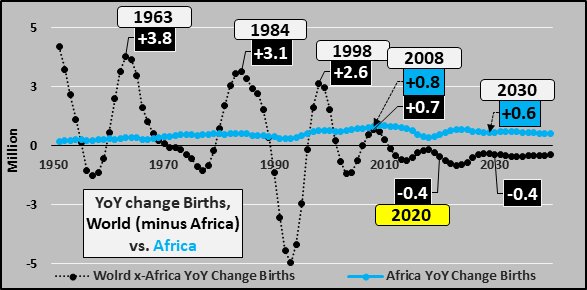
 But Africa Will Continue To Populate The Earth!?!
Finally, the charts below shows the year over year change in births among the world (excluding Africa) versus year over year change in Africa, from 1950 through 2040. Note the great gyrations for births among the world (black line) versus the smooth and steady year over year increases in Africa (aqua line)...except that one deceleration around 2018?!? All forward growth among births is anticipated to take place in Africa, essentially just offsetting the declining births among the remainder of the world.
 Getting a closer look from 2000 through 2040, the great 2008 through 2018 deceleration (still growing, but much slower) in growth of births among Africa is much more noticeable. Also of import, this UN report came out in early 2019, and the last hard data is through 2018...most everything in the report from 2019 on is projections. So, note the hard data from 2008 through 2018 is suggesting the same issues plaguing the worldwide slowdown in births is likely impacting Africa as well. Of course, with a fast rising childbearing population in Africa, the UN demographers immediately project that Africa's births will return to high year over year increases from 2019 onward...rather than suggesting that the same something that has turned global births upside down world-over will continue to show up in Africa. Definitely something to watch as, again, the only thing keeping global births from really tanking has been Africa, but I've a funny feeling this depopulation contagion is likely working it's way through Africa now.
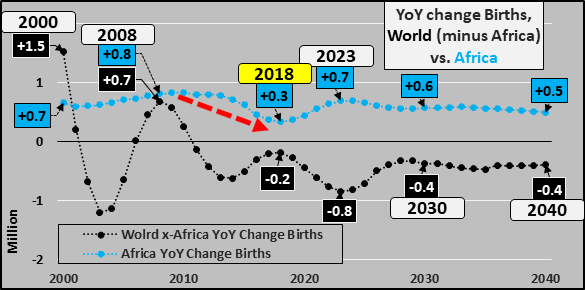 What is the point of all this? The global economy is premised on perpetual growth of demand, of supply, of money, of asset prices, etc. But the pre-eminent engine for the growth (at least for the last few centuries) has been a rising population. More people need more of everything. This means more factories, more supply networks, more infrastructure, more homes, more cars, creating more employment, etc. Including more loans and debt being lent into existence, particularly among the younger populations allowing for the purchase of vehicles, homes, etc. in the present to be repaid "later". But when the collective younger adult population, undertaking the vast majority of leverage, ceases growing and all the growth shifts to older and elderly adults, who undertake relatively low levels of debt or in elderly years move to outright deleverage...the money supply ceases to grow organically and begins to shrink antithetically to a perpetually growing system.
It has been a long run-up since WWII to get here; decades of rate hikes during accelerating demand (constricting supply of money and causing inflation), then decades of rate cuts during decelerating demand (expanding supply of money and causing deflation but simultaneously asset inflation), resultant debt through individuals, corporations, and federal governments, all intertwined with the deceleration of population growth. Since 2009, the Fed is committed to buying bonds so as to avoid a free-market pricing for those bonds and avoid yields on US debt that would soar and consume much/most of the federal taxes collected. The Fed is also now committed to not allow free-market pricing of assets based on decelerating population growth of young and large deleveraging among elderly. I think it is also highly likely the Fed (and/or agents at its direction) are also manipulating precious metals and/or crypto's so as to hide the severity of the situation.
All of this inorganic money creation taking place now with the Fed (and central banks world-over) is to mask the fundamental accelerating weakness that a low population growth can organically support. The Federal government and Federal Reserve have now gone so far that any deceleration in inorganic growth (let alone outright declines in balance sheet, rate hikes, declines in excess reserves, tax hikes, lower federal deficits) have a high potential to take the economy into not a recession but a depression unlike the world has known. The primary ingredients for removing ourselves from previous recessions/depressions no longer exist. Global demand will begin declining indefinitely as this demographic picture plays out and rates back at zero will do little to move the needle (aside from more asset inflation). The fast rising population of elderly will continue to consume less than they did in their prime years and deleverage more...far beyond the capability of the young adults to offset the financial, economic, and currency impacts. The likely picture is that a generation(s) reset is likely in the offing before the demographic and depopulation dynamics can be turned around, before the debt can all be extinguished, before the overcapacity can be expunged, and order restored.
And I guess, the trillion dollar question should be how did we get here? Were the gyrations in the population and subsequent decelerations (and imminent population collapses in many nations/regions) simply the result of birth care becoming widely available, urbanization, female employment rates, etc. etc. that happened of their own accord...or if instead this is by design as central banks had an over-riding mandate since the 1970's (not unlike China...but by a different means), only now becoming clear?!? Was this simply humankind going beyond itself or was this imminent collapse centrally designed and engineered?
 Latin America / Caribbean / South America
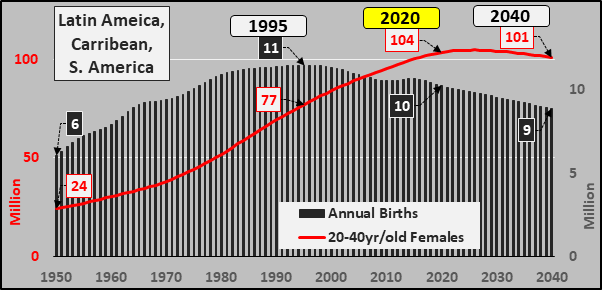
 Japan 20 to 40yr/old females, Annual Births
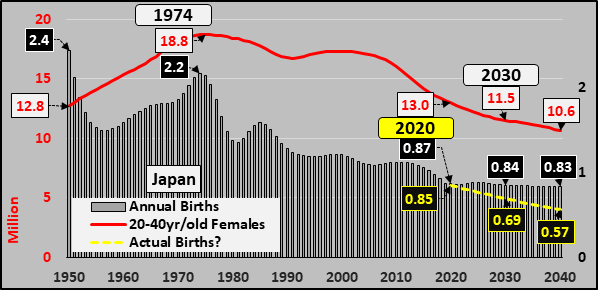
 South Korea 20 to 40yr/old females, Annual Births